Getting Started
Prerequisites
The Autonomous Learning Library requires a recent version of PyTorch (at least v2.2.0 is recommended). Additionally, Tensorboard is required in order to enable logging. We also strongly recommend using a machine with a fast GPU with at least 11 GB of VRAM (a GTX 1080ti or better is preferred).
Installation
The autonomous-learning-library can be installed from PyPi using pip:
pip install autonomous-learning-library
This will only install the core library. If you want to install all included environments, run:
pip install autonomous-learning-library[all]
You can also install only a subset of the enviornments. For the list of optional dependencies, take a look at the setup.py.
An alternate approach, that may be useful when following this tutorial, is to instead install by cloning the Github repository:
git clone https://github.com/cpnota/autonomous-learning-library.git
cd autonomous-learning-library
pip install -e .[dev]
dev will install all of the optional dependencies for developers of the repo, such as unit test dependencies, as well as all environments.
If you chose to clone the repository, you can test your installation by running the unit test suite:
make test
This should also tell you if CUDA (the GPU driver) is available.
Running a Preset Agent
The goal of the Autonomous Learning Library is to provide components for building new agents. However, the library also includes a number of “preset” agent configurations for easy benchmarking and comparison, as well as some useful scripts. For example, an a2c agent can be run on CartPole as follows:
all-classic CartPole-v0 a2c
The results will be written to runs/a2c_CartPole-v0_<DATETIME>, <DATATIME> is generated by the library.
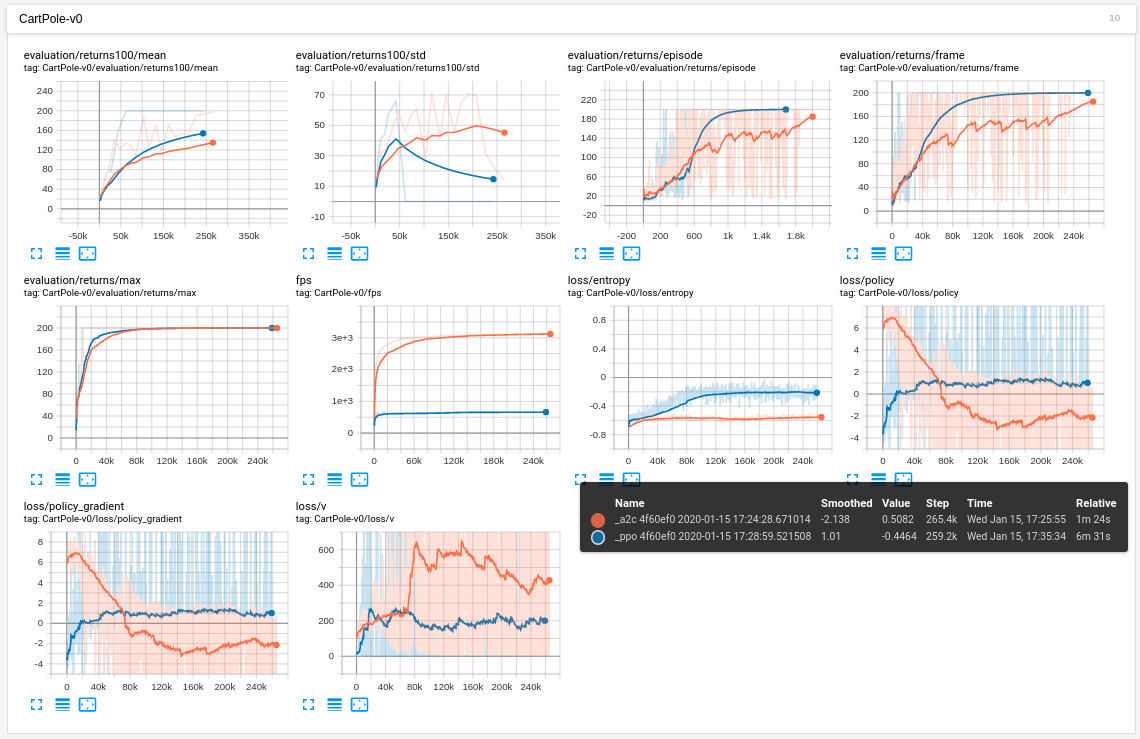
You can view these results and other information through tensorboard:
tensorboard --logdir runs
By opening your browser to `http://localhost:6006`_, you should see a dashboard that looks something like the following (you may need to adjust the “smoothing” parameter):
If you want to compare agents in a nicer, format, you can use the plot script:
all-plot --logdir runs
This should give you a plot similar to the following:
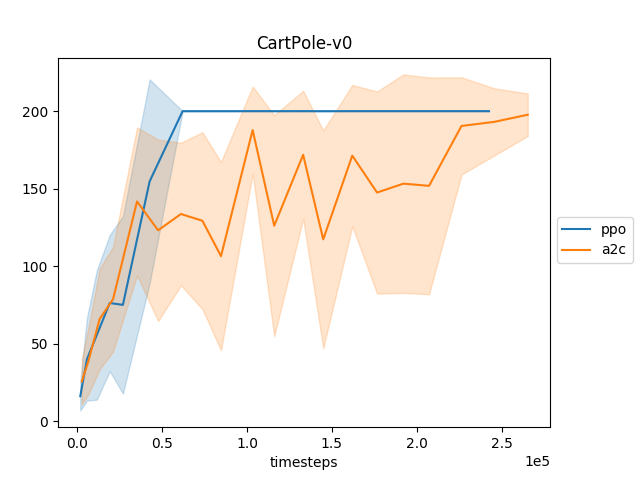
In this plot, each point represents the average of the episodic returns over the last 100 episodes for every 100 episodes. The shaded region represents the standard deviation over that interval.
Finally, to watch the trained model in action, we provide a watch scripts for each preset module:
all-watch-classic CartPole-v0 runs/a2c_CartPole-v0_<DATETIME>/preset.pt
You need to find the <id> by checking the runs directory.
Each of these scripts can be found the scripts directory of the main repository.
Be sure to check out the all-atari and all-mujoco scripts for more fun!